Tagged: tracking

Continuous Visibility, No More Dashboards

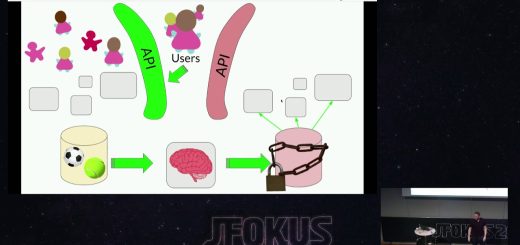
Tired of the business asking you questions about your software that you don’t know the answer to? Let’s get some visibility! This presentation covers the journey from how James Brown and his team evolved visibility in their systems, reduced those 3am calls, proposes throwing those overhead dashboards in the bin...

group meeting table

Restart in Project Management

Diana Larsen and Ainsley Nies define the project liftoff as the activity that will “generates the momentum teams need to overcome the inertia presented by lack of common purpose, unclear communication channels, undefined working relationships, and other areas of ambiguity. A liftoff also provides the positive force that moves a...

The Pomodoro Technique

The Pomodoro Technique is a time management tool; we’ll see how to work with it as freelancers and in a team. The technique is not only related to programming, but was invented by a programmer: it’s based on timeboxing on periods of 25 minutes called Pomodoros (tomatoes) from the shape...

Scrum Velocity for Non-Agile Teams

This short article provides an approach to adapt the Scrum concept of velocity to traditional project teams that are working without using the sprints/iterations of Agile project frameworks. In Scrum, velocity is how much product backlog effort a team can handle in one sprint.

Visual Project Management

Many project tracking taskboards look like they were imposed on the team. They are monochromatic, small and rarely providing too much useful information. A clear and informative taskboard is the heart of a successful team. It keeps everyone focused, radiates loads of information useful on many occasions.

Metrics in Distributed Product Development

In project management, the measurements and metrics are important activities for successful product development. This article describes a set of metrics successfully used in industrial practice in distributed product development. Based on the experiences, the reasoning for selecting these metrics was that they are easy to capture and can be...

Scrum BurnUp Charts

A Scrum BurnUp Chart is a specific Big Visible Chart that is used to show progress for a release or iteration. The horizontal axis represents Time and the vertical axis represents Scope. For a release burn up the horizontal axis is used to represent iterations while for an iteration burn...